

The phrase “Bitcoin traders see signs of selloff easing as token steadies” reflects a turning point in the crypto market. After a period of intense volatility and sharp downward pressure, Bitcoin’s price action has begun to exhibit early stability that contrasts with the chaos of recent weeks. Bitcoin Selloff Slows. Traders who watched liquidation cascades, panic-driven exchange inflows, and emotionally charged selling are now observing calmer market behavior characterized by tighter ranges and reduced momentum on the downside. Although Bitcoin is not yet in a full-fledged recovery, the environment has shifted from extreme fear to cautious recalibration.
This transition is significant because Bitcoin’s market structure often transforms quietly. The most important changes typically occur beneath the price chart before any visible reversal emerges. On-chain metrics begin to improve, selling activity lightens, spot buying absorbs more supply, and derivatives leverage normalizes. Traders who follow these signals closely understand that stabilizing price action is often the first step in the rebuilding phase that follows a major correction. The growing consensus that the selloff is easing does not imply that Bitcoin is ready to surge, but it does suggest the downtrend may be losing its grip.
The following in-depth analysis explores why Bitcoin appears to be stabilizing, how traders interpret this shift, what on-chain and macroeconomic signals are influencing market sentiment, and what this phase means for both short-term participants and long-term investors. The goal is to break down the evidence behind the emerging narrative and to explain why many traders believe that the most aggressive phase of the current selloff may be behind us, even if uncertainty remains.
Why the Bitcoin Selloff Appears to Be Losing Momentum
When a major correction strikes, Bitcoin typically goes through a predictable cycle of behavior that begins with high volatility and ends with consolidation. The initial part of the selloff is marked by panic selling, forced liquidations, leveraged unwinding, and heavy inflows to exchanges as traders rush to exit positions. This is the phase dominated by fear, emotion, and momentum. However, as the selling exhausts itself, the market gradually moves into a period where volatility cools, liquidations decline, and fewer coins move toward exchanges. This is the environment that Bitcoin is entering now.
The reason traders are increasingly confident that selling pressure is weakening is evident across several market indicators. Long-term holders, who often drive the final legs of a capitulation, are reducing their selling activity. Exchange inflows that spiked during the height of fear are declining, suggesting that fewer holders are preparing to sell. Derivatives markets, which previously amplified volatility with extended leverage, are beginning to show signs of normalization as open interest resets and funding rates return toward equilibrium. These developments collectively indicate that the intense downward momentum is no longer accelerating.
Another crucial factor behind the easing selloff is the behavior of Bitcoin’s largest holders, often referred to as whales. These players significantly influence liquidity conditions due to the sheer size of their positions. While they were notably active during the decline, recent activity suggests a shift toward patience rather than continued distribution. The slowdown in whale-driven selling, combined with a general reduction in large-scale transactions to exchanges, supports the growing belief that the market is entering a more balanced stage. It is during such transitions that price often begins to steady, even if a full reversal is not yet visible.
The Shift From Panic to Patience in Market Sentiment
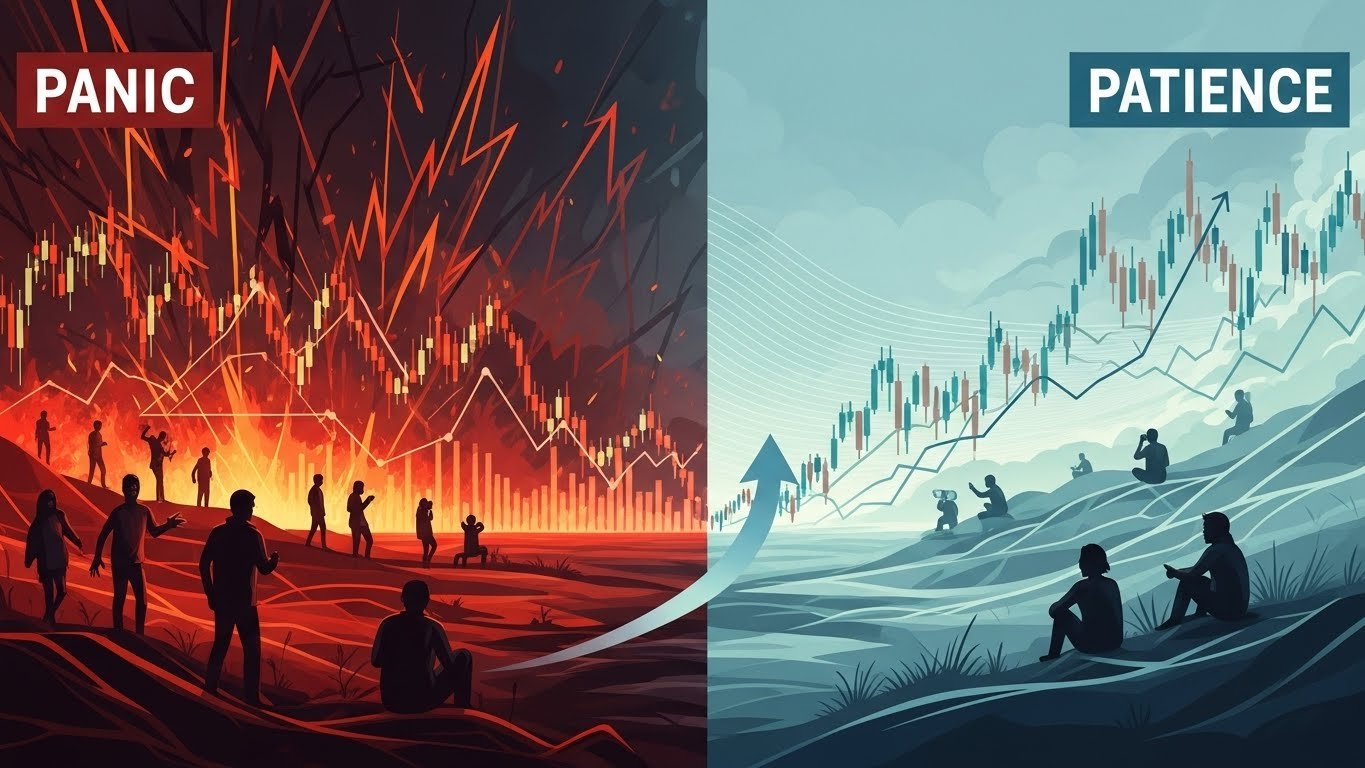
As Bitcoin steadies, market sentiment undergoes an emotional transformation. During the worst days of the selloff, fear was universal. Traders watched dramatic drops, analysts debated whether deeper lows were inevitable, and social sentiment reflected a belief that the market could continue to spiral. However, the shift occurring now is both psychological and structural. Instead of widespread fear, the mood is moving toward cautious curiosity. Conversations on social platforms and trading communities increasingly focus on whether Bitcoin may be entering a consolidation phase rather than free-falling into deeper losses.
Sentiment indicators that plunged to extreme fear levels have begun to recover. This is not a sign of euphoria but rather a return to balance. Traders are no longer preparing for immediate catastrophic declines; they are instead analyzing potential accumulation zones, support levels, and long-term trend structures. The tone among analysts has changed as well, with many now discussing Bitcoin’s sideways trading as evidence of price digestion rather than capitulation.
This emotional shift is critical because sentiment often changes before price trends do. It signals that traders are recalibrating expectations and that the reflexive behavior that drives panic selling is diminishing. This sort of calm, even if temporary, can create the conditions necessary for Bitcoin to stabilize more firmly, especially when supported by improving technical and on-chain metrics.
Long-Term Holder and Whale Activity Signals a Cooling of Selling Pressure
Long-term holders play a central role in Bitcoin market cycles. When this group begins selling aggressively, it typically signals that a correction is deepening. However, when their sales slow, it often marks the beginning of market stabilization. Current on-chain data shows that long-term holders have significantly reduced their distribution. This suggests a renewed conviction as well as a willingness to wait out volatility rather than realize losses.
Whales also appear to be adopting a less aggressive stance. During the height of the selloff, whale wallets sent substantial amounts of Bitcoin to exchanges, fueling panic among smaller holders. More recently, these movements have slowed, and some whale accumulation patterns are starting to reappear. The shift from distribution to neutrality—or even selective accumulation—provides further evidence that the selloff is weakening.
The interaction between whales, long-term holders, and exchange behavior offers one of the clearest signals of a potential easing in selling pressure. When these groups stop fueling downward momentum, spot markets gain room to breathe. Over time, reduced selling combined with renewed interest from opportunistic buyers can help solidify support levels and increase price stability. This does not guarantee a sustained rally, but it does suggest that the most aggressive downward phase may be fading.
What Bitcoin Price Stabilization Really Means for the Market
When analysts say that the Bitcoin price is steadying, they refer to a pattern where the price moves sideways within a defined range rather than continuing an aggressive downtrend. This stabilization is often uncomfortable because it feels directionless. However, historically, periods of consolidation following major selloffs are essential to resetting the market.
Consolidation allows the imbalance created during the decline to work itself out. Market participants on both sides reassess their positions, and liquidity deepens as neither side dominates. Volatility decreases, signaling that the market is entering a more thoughtful, less emotional phase. This environment creates opportunities for traders who rely on technical structures, as defined support and resistance levels become more relevant.
In the current phase, Bitcoin appears to be forming such a consolidation pattern. Candlestick ranges have narrowed, volumes have stabilized, and deep wicks—signs of extreme volatility—have become less frequent. This behavior suggests that the market is establishing a temporary equilibrium while participants wait for clearer macroeconomic signals or stronger on-chain evidence of accumulation. Although consolidation is not a bullish signal by itself, it is a necessary prerequisite for any sustainable upward move.
The Importance of Key Support and Resistance Zones During Consolidation
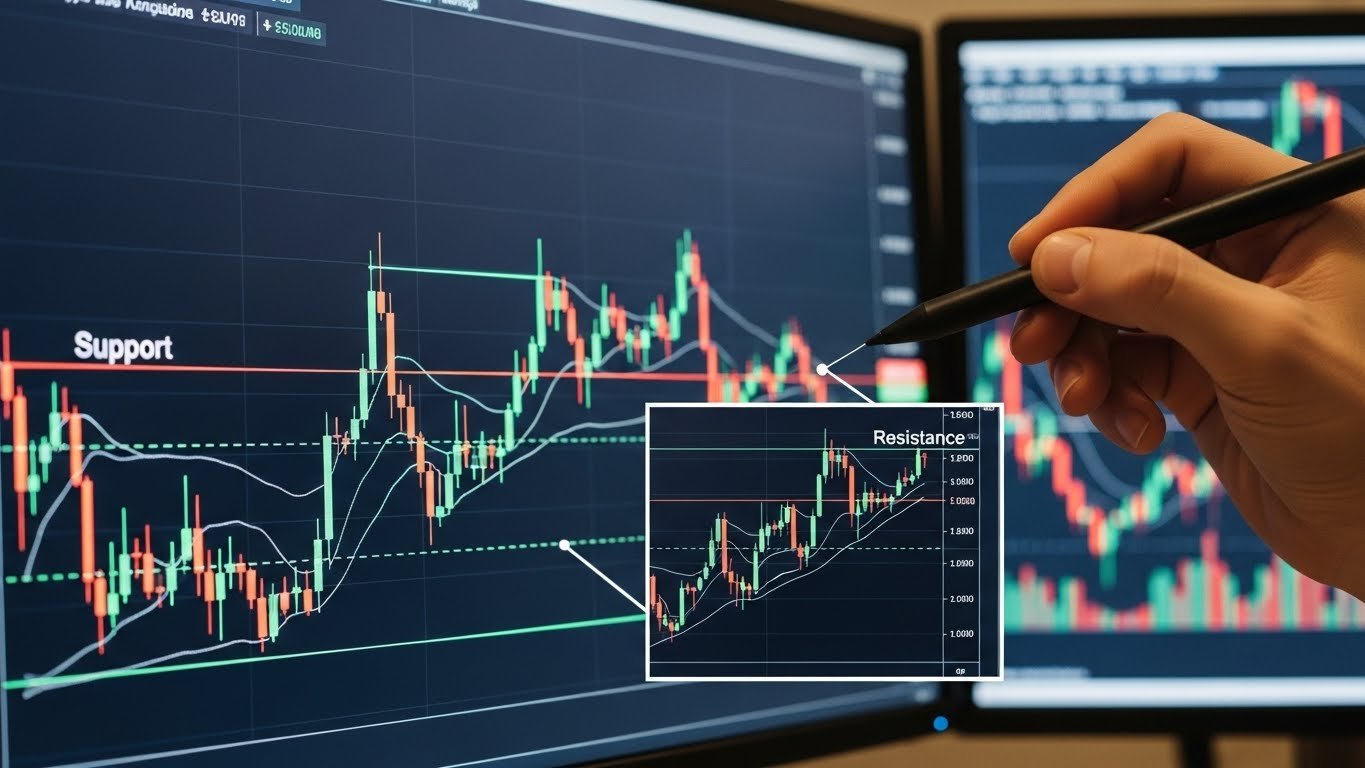
When Bitcoin steadies after a selloff, traders focus heavily on key support and resistance levels. Support zones represent areas where buyers have historically stepped in, while resistance zones mark levels where selling pressure tends to re-emerge. During consolidation, these zones create the boundaries within which the price oscillates. Their significance grows because they allow traders to anchor their strategies on predictable behavior rather than the chaos of the prior downtrend.
Currently, Bitcoin is trading in a defined range that aligns with previous areas of high liquidity. This range is important because it reflects a shared agreement between buyers and sellers about Bitcoin’s fair value in the aftermath of the selloff. If price consistently holds above support without breaking down under moderate pressure, it signals underlying strength. Conversely, if Bitcoin repeatedly tests resistance without breaking through, it suggests that buyers are not yet strong enough to shift the trend.
The interaction between these levels often shapes the next major move. A decisive break above resistance, fueled by volume and positive sentiment, could indicate that the recovery phase is beginning. A breakdown below support, on the other hand, would signal that the selloff has resumed. Understanding this dynamic is essential for traders who want to navigate the consolidation phase with precision rather than speculation.
The Significance of Cooling Volatility for Bitcoin Traders
Volatility is one of Bitcoin’s defining characteristics, but its behavior during stabilization is particularly instructive. After the initial panic-driven selloff, volatility begins to narrow as traders become more deliberate. Candle sizes shrink, intraday swings decrease, and long wicks become less frequent. This cooling volatility indicates that the market is entering a thoughtful, measured phase where liquidity broadens, and emotional reactions diminish.
For Bitcoin traders, reduced volatility is not simply a sign of calm; it is an opportunity. When the market becomes less chaotic, price patterns become clearer, and technical analysis becomes more reliable. Traders can employ range-bound strategies, exploit support and resistance with greater confidence, and identify potential breakout zones well in advance. Although the quieter environment may appear dull to newcomers, experienced participants understand that it often precedes significant directional moves. Bitcoin has repeatedly shown that long periods of compression can lead to powerful expansions, whether upward or downward.
The current cooling of volatility,y therefore, represents a pivotal moment. It signals the potential end of the panic phase and the beginning of structural recalibration. Whether the next major move is bullish or bearish, this quieter period allows traders to position themselves strategically rather than emotionally.
On-Chain Data Providing Clues to a Potential Bottom
On-chain data is often the most revealing indicator during transitional market phases. Analysts track metrics such as realized losses, exchange flows, long-term holder behavior, and deviations from long-term moving averages to identify moments of capitulation and recovery. During the latest selloff, Bitcoin experienced a surge in realized losses as short-term holders sold at a loss. This is typical during deep corrections and often marks the final stage of panic.
As Bitcoin steadies, these realized losses have begun to decline. Exchange inflows have dropped as fewer holders feel compelled to sell, and the supply held by long-term holders is increasing again. These trends suggest that the capitulation phase may be ending. Funding rates that had turned deeply negative during the selloff are showing signs of recovery, indicating less aggressive short positioning.
The stabilization in these on-chain metrics does not guarantee that the bottom is already in place, but it does indicate that the conditions necessary for a bottom are forming. Traders often look for convergence among multiple data points, and the current alignment across realized losses, exchange flows, and funding rates is a positive sign that the selloff is losing steam.
Derivatives Markets Reflecting a Healthier Structure
Alongside on-chain indicators, derivatives markets offer valuable insights into market behavior. During periods of intense decline, open interest tends to spike as traders either chase downside momentum or attempt to hedge aggressively. This heightened leverage often leads to liquidation cascades that accelerate the decline. In the current environment, however, open interest has decreased significantly, funding rates have normalized, and the spread between spot and futures prices has narrowed.
These developments point to a healthier market structure. With fewer highly leveraged positions in play, the risk of large liquidation events is reduced. This allows the spot market to exert more influence on price, creating more stable conditions. Traders appreciate this environment because it supports more sustainable price action rather than the extreme volatility caused by leveraged speculation.
As Bitcoin steadies, the derivatives landscape suggests that the market is resetting, not collapsing. This distinction is important for both short-term traders and long-term investors, as it shapes expectations for the next phase of price discovery.
Macro Conditions Cooling After Fueling the Initial Drop
Bitcoin does not exist in isolation. The recent selloff was heavily influenced by macroeconomic factors such as fluctuating interest rate expectations, concerns about liquidity, and broader risk-off sentiment. When financial markets face uncertainty, speculative assets like Bitcoin tend to experience sharper declines. However, as some of these macro pressures ease, markets across the board begin to stabilize.
Economic indicators that previously created fear are beginning to show signs of moderation. Investor sentiment in traditional markets is improving, and risk appetite is slowly returning. These broader conditions influence Bitcoin because institutional traders and funds increasingly treat it as part of the global risk-asset ecosystem. As volatility in equity and bond markets cools, Bitcoin often experiences parallel stabilization.
The less hostile macro environment does not automatically imply a bullish trend for Bitcoin, but it creates a backdrop in which stabilization becomes more feasible. With fewer external shocks to amplify volatility, traders can focus more on Bitcoin’s internal dynamics rather than reacting to every macro headline.
Spot ETFs and Institutional Behavior in the Current Stabilization Phase
The launch of spot Bitcoin ETFs transformed the structure of Bitcoin’s market. These products attracted significant inflows during the rally, amplifying upside momentum. Conversely, outflows from these ETFs contributed to the intensity of the recent selloff. Large redemptions added pressure during the downturn and heightened fear among retail traders.
However, even with recent outflows, the presence of ETFs also strengthens Bitcoin’s long-term framework. Institutional investors now have a regulated, convenient on-ramp to accumulate Bitcoin. As fear cools and volatility declines, some of these participants are starting to reconsider their positioning. This behavior adds another layer of support to Bitcoin’s stabilization.
The fact that Bitcoin is holding key levels despite ETF outflows suggests that underlying demand remains stronger than the headlines imply. If macro conditions improve or inflows return, ETFs could become a powerful stabilizing force once again.
Trading Approaches During a Steadying Bitcoin Market
A consolidating Bitcoin market requires a different approach compared to high-volatility phases. Short-term traders generally focus on navigating the defined range. Since volatility has cooled, the rice tends to react more predictably to technical levels. This environment rewards patience, precision, and disciplined risk management. Traders who chase breakouts too quickly often get caught in false moves, while those who wait for confirmed signals can use the consolidation phase to structure clearer entries and exits.
Long-term investors view this phase differently. For them, a steadying Bitcoin price represents an opportunity to accumulate without the emotional intensity of a rapid selloff or the pressure of an overheated rally. Historical patterns show that accumulation during stabilization phases tends to yield strong long-term returns when the broader trend resumes. Investors who recognize the value of reduced volatility can use this moment to evaluate their long-term positioning without fear-driven decision-making.
Both groups benefit from understanding that stability does not negate risk. Consolidation can break down if external shocks occur or if buyers lose conviction. Nevertheless, the reduced selling pressure and calmer price action make this period an advantageous moment for strategic planning.
What Could Disrupt the Emerging Stabilization Narrative
Even though many traders believe that selling pressure is easing, several factors could still disrupt the stabilization. A major unexpected macro event, such as a surge in interest rates or geopolitical turmoil, could reignite risk-off panic. New regulatory developments targeting major crypto entities could also undermine confidence. Additionally, a decisive breakdown below current support levels would invalidate the current stabilization pattern and signal renewed downside momentum.
Understanding these risks is essential because stabilization is not a guarantee of recovery. It is a neutral state, neither bullish nor bearish on its own. The market’s next significant move will depend on how traders react to new information, how long-term holders behave, and how macroeconomic conditions evolve. The fragility of consolidation means that vigilance is necessary even when fear subsides.
Conclusion
The idea that Bitcoin traders see signs of selloff easing as the token steadies captures the quiet transformation unfolding in the market. After weeks of aggressive selling, panic-driven liquidations, and emotional turmoil, Bitcoin is entering a phase defined by calmer price action and reduced volatility. On-chain indicators show improving conditions. Derivatives markets appear healthier. Macro pressures are moderating. Long-term holders and whales are no longer pushing prices down with heavy distribution.
This environment does not guarantee a bullish reversal, but it does mark a meaningful shift. It is an opportunity for traders and investors to observe the market with clarity rather than fear. As Bitcoin continues to consolidate, the foundation for its next major move is forming quietly beneath the surface. Whether that move becomes a renewed uptrend or another leg downward will depend on the interplay between sentiment, liquidity, on-chain behavior, and broader economic forces. For now, the signs of stabilization offer a moment of valuable reflection and strategic preparation.