

When the Bitcoin price plunges below a 6-month low, the shock spreads far beyond crypto Twitter. Traders stare at red charts, long-term holders feel their conviction tested, and new investors wonder if they just bought the top. Only weeks or months earlier, the mood might have been euphoric, with headlines screaming about fresh highs and unstoppable momentum. Then, almost suddenly, the Bitcoin crash narrative appears, and the same commentators who were celebrating now talk about panic, liquidations, and bear markets.
This kind of move is not new for Bitcoin. As a highly volatile asset, it has always swung between aggressive rallies and painful corrections. Yet every time BTC price today falls to a fresh multi-month low, it feels different, especially for those who are living through it for the first time. What changed? Why did buyers disappear? And how can an asset that looked so strong a short time ago lose such a large chunk of its value?
To answer those questions, you need to look beyond a single candle on the chart. The Bitcoin price plunges below a 6-month low for a combination of reasons, not just one. Macro conditions shift, ETF flows turn, big players adjust their positions, leverage unwinds, liquidity thins out, and technical levels break. None of these factors alone explains the entire crypto market sell-off, but together they create the perfect storm that drags the market down.
Macro backdrop: how global conditions push Bitcoin lower
Even though many people see Bitcoin as digital gold or a hedge against traditional finance, in practice, it often trades like a high-risk asset. When the global environment becomes uncertain or investors become more cautious, BTC price today tends to suffer along with tech stocks and other speculative plays.
Interest rates and the “risk-on / risk-off” switch
One of the most powerful forces driving all markets is interest-rate policy. When central banks cut rates or signal easy monetary conditions, investors usually move into riskier assets in search of higher returns. This is the classic risk-on environment, where Bitcoin, growth stocks, and other cryptocurrencies often thrive. Cheap money and abundant liquidity push people up the risk curve.
When the story flips and central banks either raise rates or keep them high for longer than expected, the reverse happens. Suddenly, safe assets such as government bonds or money-market instruments offer decent yields with far less volatility. Big players begin to rotate out of speculative assets and back into safety. In that kind of risk-off mood, it is no surprise that the Bitcoin price plunges below a 6-month low, because the entire pool of demand shrinks.
Traders who were happy to hold large BTC positions when money was cheap now become more defensive. Hedge funds cut exposure, quantitative strategies reduce risk, and even retail investors decide to step aside until conditions look friendlier. Selling pressure grows, but the number of willing buyers declines, so the price slides lower and lower.
Inflation, growth fears, and market sentiment
Beyond interest rates, broader economic concerns also weigh on Bitcoin. When inflation is high and growth is slowing, investors worry about stagflation, a scenario that is bad for many asset classes. Some argue that Bitcoin should act as an inflation hedge, but in reality, its behavior has been mixed. In times of stress, people often prefer cash or short-term bonds over anything volatile, even if it has a long-term hedge narrative.
When headlines are dominated by recession fears, geopolitical tensions, ns or banking stress, risk appetite typically falls. That does not mean that every macro scare will cause a Bitcoin crash, but repeated waves of negative news can slowly erode confidence and drive capital away from speculative markets. This is how the macro backdrop becomes a quiet but powerful reason why the Bitcoin price plunges below ow 6-month low instead of holding its recent highs.
ETF flows: from powerful tailwind to heavy headwind

A newer but extremely important factor in modern Bitcoin cycles is the role of spot Bitcoin ETFs. These products allow both retail and institutional investors to gain exposure to BTC through traditional brokerage accounts, without dealing directly with exchanges or self-custody. Their launch in major markets was widely seen as a sign of institutional adoption and undeniably played a role in strong price rallies.
From inflows to outflows
When these ETFs were new and popular, they attracted massive inflows. Every day, fresh capital flowed into the funds, and those issuers had to buy real Bitcoin on the open market to match their exposure. That created a steady stream of demand. It was like having a structural buyer showing up day after day, supporting the market and helping push the BTC price higher.
Eventually, however, that trend can stall. When performance starts to flatten or reverse, some investors decide to take profits. Others become nervous about volatility or macro risks. If enough holders redeem their ETF shares, the fund managers must sell Bitcoin to free up cash. What was once a tailwind becomes a headwind. Instead of buying every day, ETFs may become net sellers.
When that shift happens, it can be dramatic. A series of strong outflow days means a constant stream of BTC being offered into the market, whether prices are stable or falling. This persistent supply is one of the big reasons why the Bitcoin price plunges below a 6-month low during certain corrections. Even if some long-term holders want to buy, they might not be able to absorb all of the ETF-driven selling at current levels, forcing the price to adjust downward until equilibrium is restored.
Why ETF flows matter so much
In previous cycles, Bitcoin was dominated by spot exchange traders, miners, and early adopters. Today, the presence of large regulated funds changes the structure of the market. A single day of heavy ETF outflows can equal the volume of several mid-sized exchanges. That concentration of flows magnifies their impact.
Because ETFs also attract more traditional investors, their outflows often coincide with broader portfolio rebalancing. When stocks are falling and volatility is rising, portfolio managers might choose to cut crypto exposure at the same time as they reduce positions in high-beta equities. This creates synchronized selling across many risk assets and amplifies the speed at which the Bitcoin price plunges below a 6-month low.
Whale selling and profit-taking: how big players shape the move
Another key element is the behavior of whales and long-term holders. Whales are addresses that hold large amounts of BTC, often thousands of coins. Their decisions to buy or sell can have a significant impact on market dynamics, especially during periods of thin liquidity.
Strategic profit-taking at elevated levels
When the Bitcoin market rallies to new highs, especially after a long accumulation phase, many big holders plan to take some profits. They may not dump everything, but even selling a fraction of a large stash can translate into tens of millions of dollars worth of supply. These decisions are often systematic and unemotional. Whales might have predetermined levels where they reduce exposure, such as when the BTC price today doubles from their average entry or breaks a major psychological barrier.
This selling does not necessarily signal a loss of faith in Bitcoin. Instead, it can reflect prudent risk management, portfolio diversification, or the need to free up capital for other opportunities. However, when these sales occur around the same time that ETFs see outflows and macro sentiment turns sour, they contribute to the momentum that drives the Bitcoin price to plunge below a 6-month low narrative.
Weak hands versus strong hands
The identity of the seller also matters. Short-term speculators who bought during a hype phase often capitulate quickly once the price turns against them. They are sometimes called weak hands because they cannot tolerate large drawdowns. When they rush toward the exit, they push prices down rapidly.
In contrast, long-term holders, often referred to as strong hands, are more patient and usually accumulate during major dips. However, even strong hands will sometimes reduce positions after extraordinary rallies, especially if they have been holding for years. A combination of weak-hand capitulation and strong-hand rebalancing creates intense selling pressure, especially at the point where the Bitcoin price plunges below a 6-month low and fear is dominating sentiment.
Leverage, liquidations, and the domino effect
Bitcoin markets are not only driven by spot buying and selling. A huge amount of activity comes from derivatives, such as futures and perpetual swaps. These instruments allow traders to take large positions with relatively small amounts of capital by using leverage. Leverage can supercharge gains, but it also magnifies losses and creates the conditions for cascading liquidations.
How leveraged longs collapse in a downturn
During a powerful rally, many traders become overconfident and open large leveraged long positions, betting that the BTC price will continue to rise. As long as the price moves in their favor, they can make impressive gains with relatively small initial margins. However, every leveraged position has a liquidation level. If the price falls below that threshold, the exchange will forcibly close the position to prevent further losses, selling the underlying contracts into the market.
When the market turns down, especially from a high and crowded level, these liquidations start to occur. At first, they might be limited, but as price keeps falling, more and more leveraged positions reach their liquidation point. Each forced closure adds additional selling pressure, pushing the price even lower. This is the classic domino effect that transforms a normal correction into a full-blown crypto market sell-off.
Thinning liquidity during panics
At the same time, liquidity in the order book often dries up during sharp drops. Market makers, who normally provide bids and offers, may pull back their quotes or widen their spreads to protect themselves from sudden moves. Long-term buyers prefer to wait instead of catching a falling knife. As a result, the market becomes fragile. It only takes modest selling to move the price dramatically.
In this environment, a large liquidation or whale sale can slice through the order book, causing slippage and big red candles. Observers see the chart, panic spreads, and more investors decide to sell. By the time the price stabilizes, the Bitcoin price plunges below a 6-month low, not because of one piece of fundamental news, but because of a chain reaction driven by leverage, fear, and thin liquidity.
Technical analysis: broken support and bearish momentum
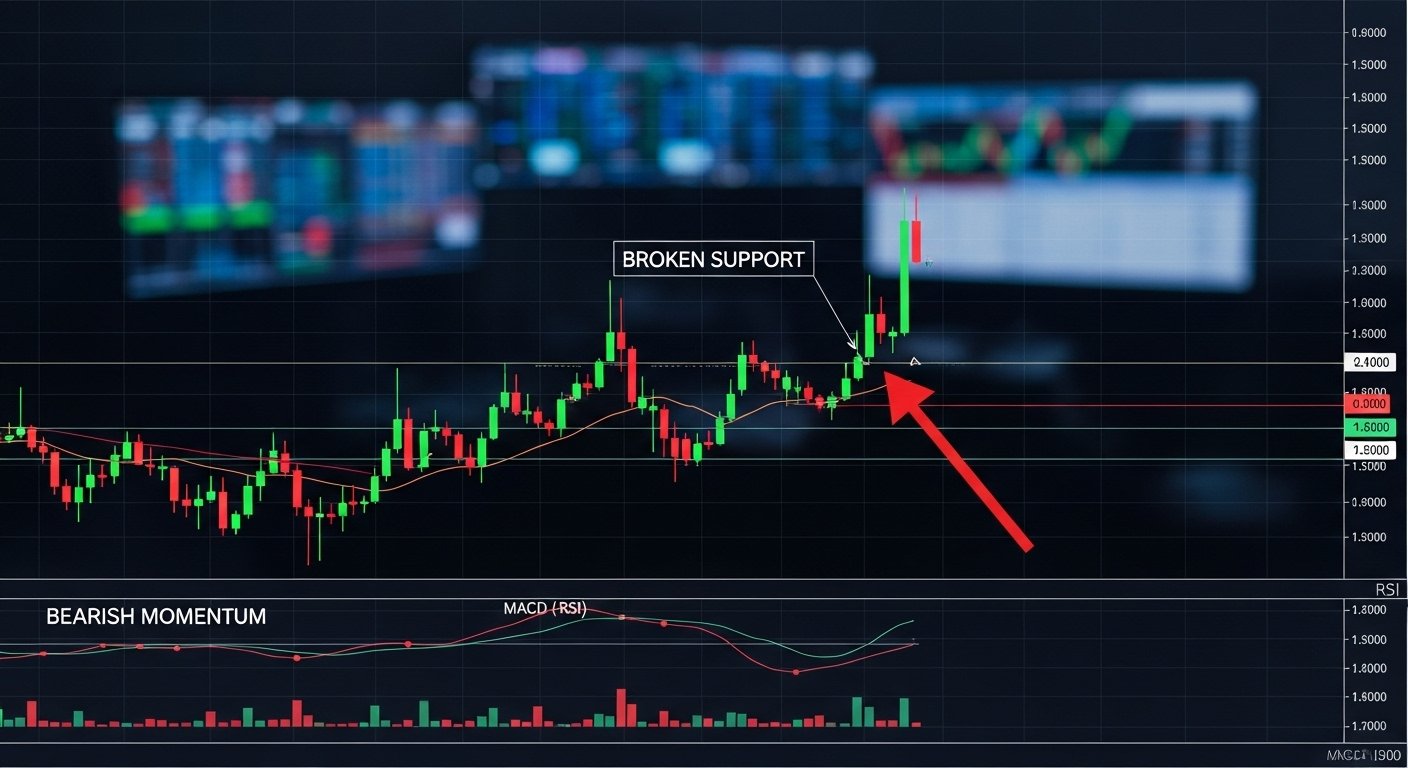
Technical analysis may not predict the exact future, but it plays a major role in shaping trader behavior. When important levels are broken on the chart, algorithms and human traders alike react in similar ways, creating self-fulfilling patterns.
Key support levels are turning into resistance
Every rally leaves behind levels where price previously paused or reversed. These zones become support on the way down. When Bitcoin revisits such support and bounces, traders feel reassured. When it fails to hold and breaks below, the mood shifts from optimism to worry.
The moment when the Bitcoin price plunges below a 6-month low is often the moment when a major support level has been broken. Daily or weekly closes below a strong support area can activate stop-loss orders, trend-following algorithms, and risk-management rules for funds. These systems rarely care about the story; they react to the signal. If the signal says that the trend has turned bearish, they sell or go hort, adding to the downward pressure.
Once support is broken, it often becomes resistance. The next time Bitcoin attempts a bounce, sellers step in around that old level, fearing that the rebound might fail. This dynamic keeps the market pinned lower for a while and makes it harder for bulls to regain control.
Moving averages, trendlines, and momentum indicators
Beyond horizontal support and resistance, many traders watch moving averages, diagonal trendlines, and momentum oscillators. A breakdown below a widely followed average, such as the 50-day or 200-day moving average, is often seen as a sign that the Bitcoin crash could deepen. Downward crossovers, where a shorter moving average falls below a longer one, reinforce that bearish view.
Similarly, when momentum indicators show strong negative readings, they confirm that sellers are in control. This does not guarantee that prices will keep falling, but it increases the probability that rallies will be sold until the market can reset. The combination of broken supports, negative momentumm and bearish sentiment creates a technical environment where the Bitcoin price plbelow beloa w 6-month low and buyers struggle to mount a sustainable recovery.
Traders vs long-term investors: different reactions to the same drop
The same price move can feel completely different depending on whether you are a short-term trader or a long-term investor. Understanding these different perspectives helps explain the emotional roller coaster that accompanies every Bitcoin crash headline.
Short-term traders: volatility as both friend and enemy
For active traders, a sudden plunge below a six-month low is both a threat and an opportunity. On one hand, violent moves can wipe out positions quickly if risk is not controlled. On the other hand, high volatility creates large intraday ranges that can be profitable for those who are agile and disciplined.
Short-term traders pay close attention to Bitcoin technical analysis, order-flow signals, and sentiment shifts. They might attempt to short breakdowns, fade extreme fea, or scalp quick bounces. However, if they chase moves without a plan or use excessive leverage, they risk becoming part of the liquidation cascade that deepens the drop.
In other words, traders see the period when the Bitcoin price plummets w a 6-month low as a phase to approach with caution. Their priority is survival and risk management, not maximal profit at any cost.
Long-term holders: conviction, time horizon, and strategy
Long-term investors, especially those who believe in the multi-year potential of Bitcoin, view corrections quite differently. They expect volatility and accept that large drawdowns are part of the journey. Many of them build strategies based on dollar-cost averaging, accumulation zones, or fundamental metrics rather than daily charts.
When BTC price today flashes a new six-month low, some long-term holders may feel uneasy, especially if they bought close to the top. But those with a clear thesis and long-term horizon often see sharp dips as an opportunity rather than a disaster. They focus on adoption trends, network security, regulatory clarity, and macro factors that may play out over years rather than days.
That does not mean long-term investors never sell. They may take profits when valuations become extreme or if their personal circumstances change. But they are less likely to panic just because the Bitcoin price plunges below a 6-month low in a single volatile period.
See More: Bitcoin Price Hits $250,000 Be Ready Before 2025 Ends
Is this the end or just another Bitcoin correction?
Every time Bitcoin drops sharply, the same question appears: is this the end of the bull market, or just another correction on the way to higher prices? There is no simple answer, and anyone who pretends to know the future path with certainty is guessing. However, you can frame the situation more clearly by separating short-term noise from long-term signal.
In the short term, the Bitcoin price plunges below a 6-month low because flows, leverage, and sentiment line up in a negative way. ETF outflows, whale profit-taking, liquidation, and thin liquidity create conditions where each wave of selling hits harder than usual. Technical breakdowns and fear amplify the move, drawing in more sellers and pushing cautious buyers to the sidelines.
In the long term, the key questions revolve around adoption, regulation, macro ttrendsds and technological development. Are more people and institutions using Bitcoin? Is infrastructure improving? Are governments moving toward clearer, more predictable rules? Are the global economic conditions likely to favor scarce, digital assets over time? Answers to these questions change slowly and do not depend on any single six-month low.
If the long-term story remains intact or even strengthens, then sharp corrections, even those that feel brutal, may simply be chapters in a larger accumulation and distribution cycle. That does not guarantee new highs, but it suggests that a single plunge is not the final word on Bitcoin’s future.
Final thoughts
When the Bitcoin price plunges below a 6-month low, it is easy to let fear and frustration take over. Charts turn red, social media becomes noisy, and sensational headlines dominate the conversation. Yet beneath the drama, the mechanics are relatively clear.
Macro conditions turn less friendly, pushing investors out of risk assets. Spot Bitcoin ETFs flip from steady buyers to consistent sellers. Whales and long-term holders decide to take profits at elevated levels. Heavy leverage and forced liquidations magnify the move, while thinning liquidity allows each large order to push the price further. Technical analysis confirms the downtrend as support levels break and bearish momentum builds. Traders scramble to protect capital, and long-term investors revisit their convictions.
None of this makes a deep correction pleasant, but it does make it understandable. By recognizing the forces at play when the Bitcoin price plunges below a 6-month low, you can respond with more clarity and less emotion, whatever your time horizon or strategy may be.